
Chapter 6: IT Controlling in Small and Micro Businesses
Chapter 6 of my master's thesis "Outsourcing the IT Strategy Development Process in Austrian Small and Micro Enterprises"
Contents
This article series contains my master’s thesis “Outsourcing the IT Strategy Development Process in Austrian Small and Micro Enterprises”, which I wrote as part of the university program Management in Information and Business Technologies at the Alpen-Adria-Universität Klagenfurt.
- Chapter: Introduction
- Chapter: Definitions
- Chapter: Relevant Environments of Small and Micro Enterprises in Austria
- Chapter: Strategic Goals and Critical Success Factors of an IT Strategy
- Chapter: Strategic Courses of Action for Small and Micro Enterprises Regarding the Use of Information Technology
- Chapter: IT Controlling in Small and Micro Businesses
- Chapter: Summary and Outlook
6. IT Controlling in Small and Micro Businesses
6.1. The IT Balanced Scorecard as a Management Tool for Small and Micro Businesses
Covering the topic of IT controlling in its full depth would go beyond the scope of this thesis. For this reason, the reader is only given a rough overview of two example IT controlling frameworks as a basis for a “balanced scorecard”.
Even small businesses can benefit from using a simplified balanced scorecard (BSC) to show all business-relevant data at a glance. In these companies, the BSC cannot have the scope and complexity of one in a large organization and should therefore contain only the most important key data of the five areas “contribution to the company”, “customers”, “IT service production”, “IT use” and “potentials”.1 Mussnig and Mödritscher suggest limiting the BSC to 12 to 15 goals for small and medium-sized enterprises.2
When developing an IT BSC for small and micro enterprises, using existing data, structures and processes is of the utmost importance. A simple solution, for example as a Microsoft Excel spreadsheet, is better than no solution here3, and a step-by-step introduction of the BSC is also possible.4 Figure 17 shows as an example how a simple IT balanced scorecard could be structured. Chapters 6.2 and 6.3 present two frameworks for creating your own BSC.
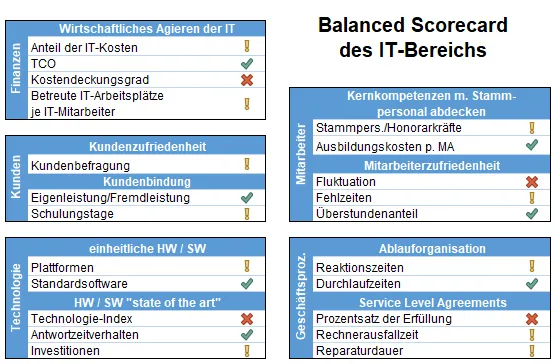 Figure 17: Example of an IT balanced scorecard.5
For small companies, introducing a balanced scorecard is often a project of its own within the strategy development process. In practice, the BSC is therefore often designed by a knowledgeable external consultant.6
6.2. The IT Controlling Framework by Kütz
The model described by Kütz is comparatively simple and, thanks to its practice-oriented approach, also applicable to small and micro enterprises.7 The balanced scorecard according to Kütz is based on the following elements, outlined in Figure 18:
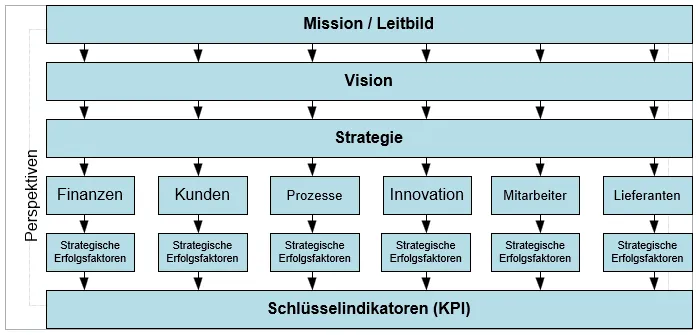 Figure 18: Elements of the IT balanced scorecard by Kütz.8
The meaning of the individual elements is briefly covered below:9
- The mission or mission statement. It states what role IT plays in the company, why it exists and what benefit it brings.
- The vision answers the question of the long-term goals the IT organization wants to achieve in the next few years.
- The strategy describes, in this context, the concrete path to achieving the goals defined in the vision.
- The perspectives state from which viewpoints the strategic goals are to be considered. Kütz considers 6 perspectives here: “finances”, “customers”, “processes”, “innovation”, “employees” and “suppliers”.
- The strategic success factors indicate which metrics significantly influence the implementation of the strategies.
- The key indicators10 are the figures that are measured most sensibly to achieve the strategic goals.
Because of its simple implementation, the framework by Kütz is also suitable for small companies. At the same time, it carries the risk of overwhelming the user with its large number of perspectives. Concentrating on a few meaningful key figures is recommended here as well.
6.3. The IT Controlling Framework by Schmid-Kleemann
Schmid-Kleemann describes a somewhat more complex framework in “Balanced Scorecard im IT-Controlling”. Here, too, the balanced scorecard is naturally based on the IT strategy and is divided into the following five strategic topics:11
- The company perspective provides information on IT use and service production. Through the (internal) users of IT systems, it delivers an indirect value contribution and is therefore an important value driver.
- The customer perspective concentrates on the internal or external customers.
- The future perspective deals with questions about the future orientation and further development of the IT area.
- The IT use perspective contains the technologies and IT architectures used in the company’s processes. The future perspective forms the basis for this.
- The IT service production perspective shows the operational value contribution of the IT organization. It is closely linked to the IT use perspective.
In summary, Figure 19 shows an example of one possible variant of the perspectives according to Schmid-Kleemann:
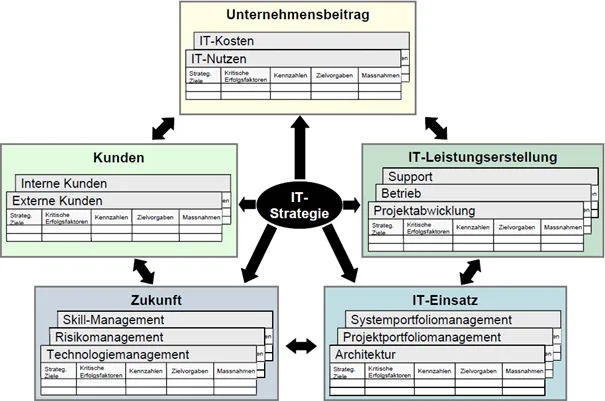 Figure 19: Elements of the IT balanced scorecard by Schmid-Kleemann.12
The framework was worked out in detail and extensively documented by Schmid-Kleemann.13 Because of its high complexity, however, the possibility of a successful and economical implementation in small companies is questionable, so it was considered in this thesis only as a reference and a source of ideas.
Footnotes
-
Cf. (Schmid-Kleemann, 2004, p. 147), (Rüter & Schröder, 2006, p. 113), (Chow, Haddad, & Williamson, 1997, p. 6). ↩
-
Cf. (Mussnig & Mödritscher, 2007, p. 363). ↩
-
Cf. (Gadatsch & Mayer, 2010, p. 148), (Blankenhorn & Thamm, 2008, p. 15). ↩
-
Cf. (Mussnig & Mödritscher, 2007, p. 388). ↩
-
Source: adapted from (Wintersteiger & Tiemeyer, 2011, p. 77). ↩
-
Cf. (Probst, 2007, p. 178), (Weber & Schäffer, 2000, p. 94ff). ↩
-
Cf. (Kütz, 2002, p. 62ff). ↩
-
Source: (Kütz, 2002, p. 62) (slightly modified). ↩
-
Cf. (Kütz, 2002, p. 62ff). ↩
-
Also called key figures or “key performance indicators” (KPIs) in the literature. ↩
-
Cf. (Schmid-Kleemann, 2004, p. 135f). ↩
-
Source: adapted from (Schmid-Kleemann, 2004, p. 147). ↩
-
Cf. (Schmid-Kleemann, 2004, p. 30), (Gadatsch, 2009, p. 296). ↩